Exercise 1: Collecting Metrics
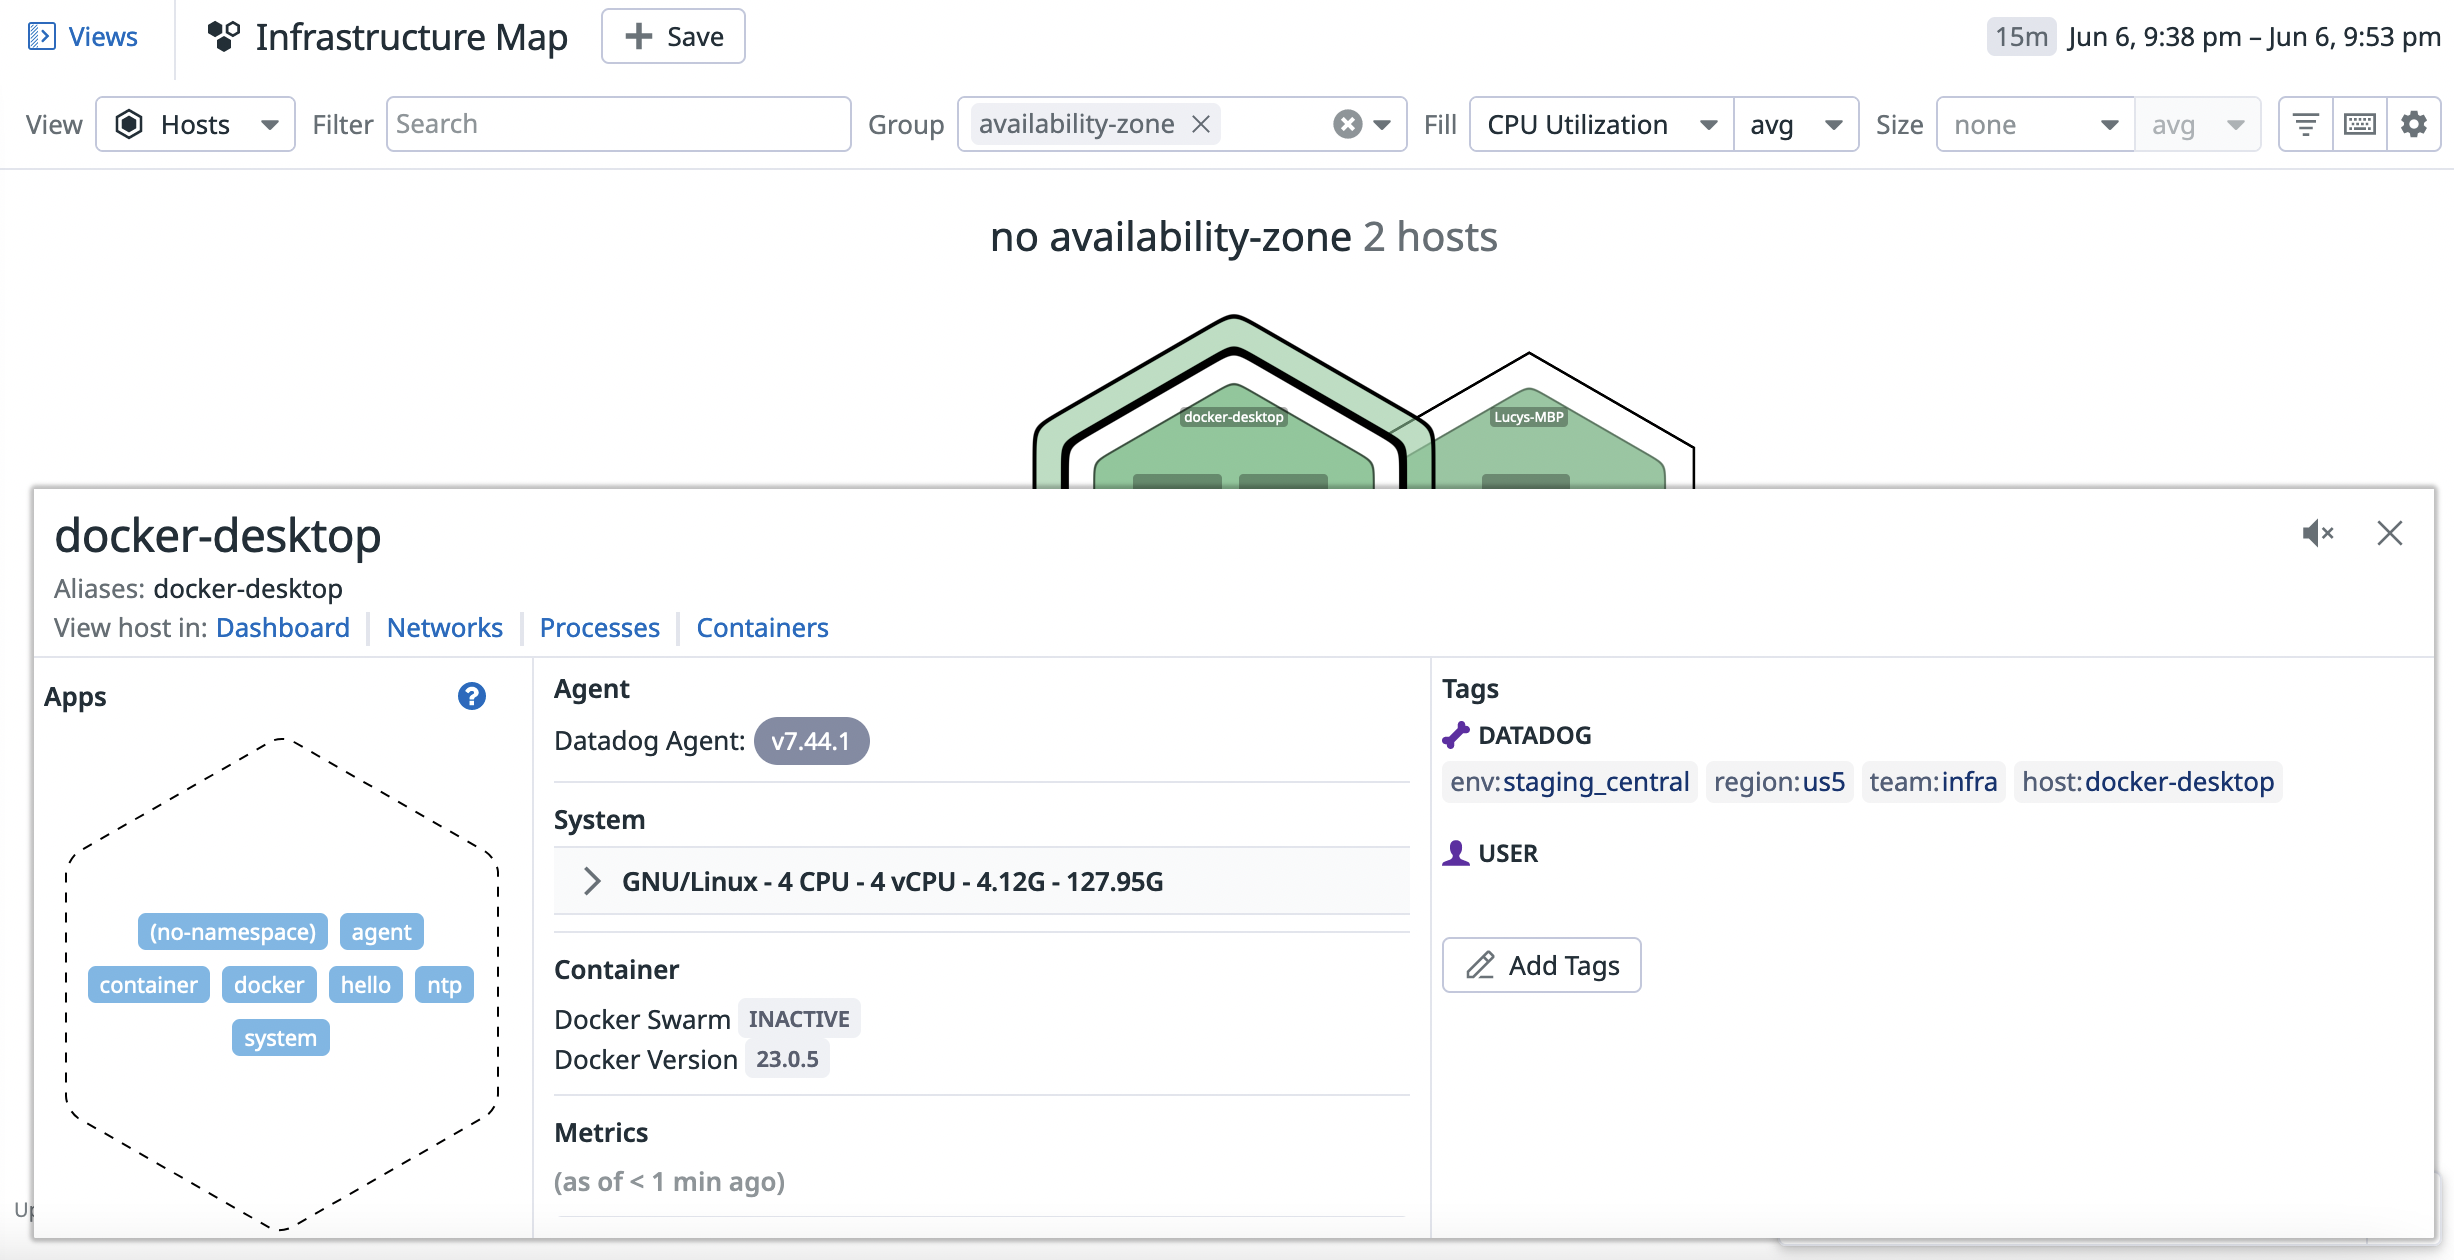
- Postgres
conf.yaml:
init_config:

instances:
  ## @param host - string - required
  ## The hostname to connect to.
  ## NOTE: Even if the server name is "localhost", the agent connects to
  ## PostgreSQL using TCP/IP, unless you also provide a value for the sock key.
  #
  - host: localhost

    ## @param port - integer - required
    ## Port to use when connecting to PostgreSQL.
    #
    port: 5432

    ## @param user - string - required
    ## Datadog Username created to connect to PostgreSQL.
    #
    username: datadog

    ## @param pass - string - required
    ## Password associated with the Datadog user.
    #
    password: "datadogcandidate"

    ## @param dbname - string - optional - default: postgres
    ## Name of the PostgresSQL database to monitor.
    ## Note: If omitted, the default system postgres database is queried.
    #
    # dbname: "<DB_NAME>"

    # @param disable_generic_tags - boolean - optional - default: false
    # The integration will stop sending server tag as is reduntant with host tag
    disable_generic_tags: true
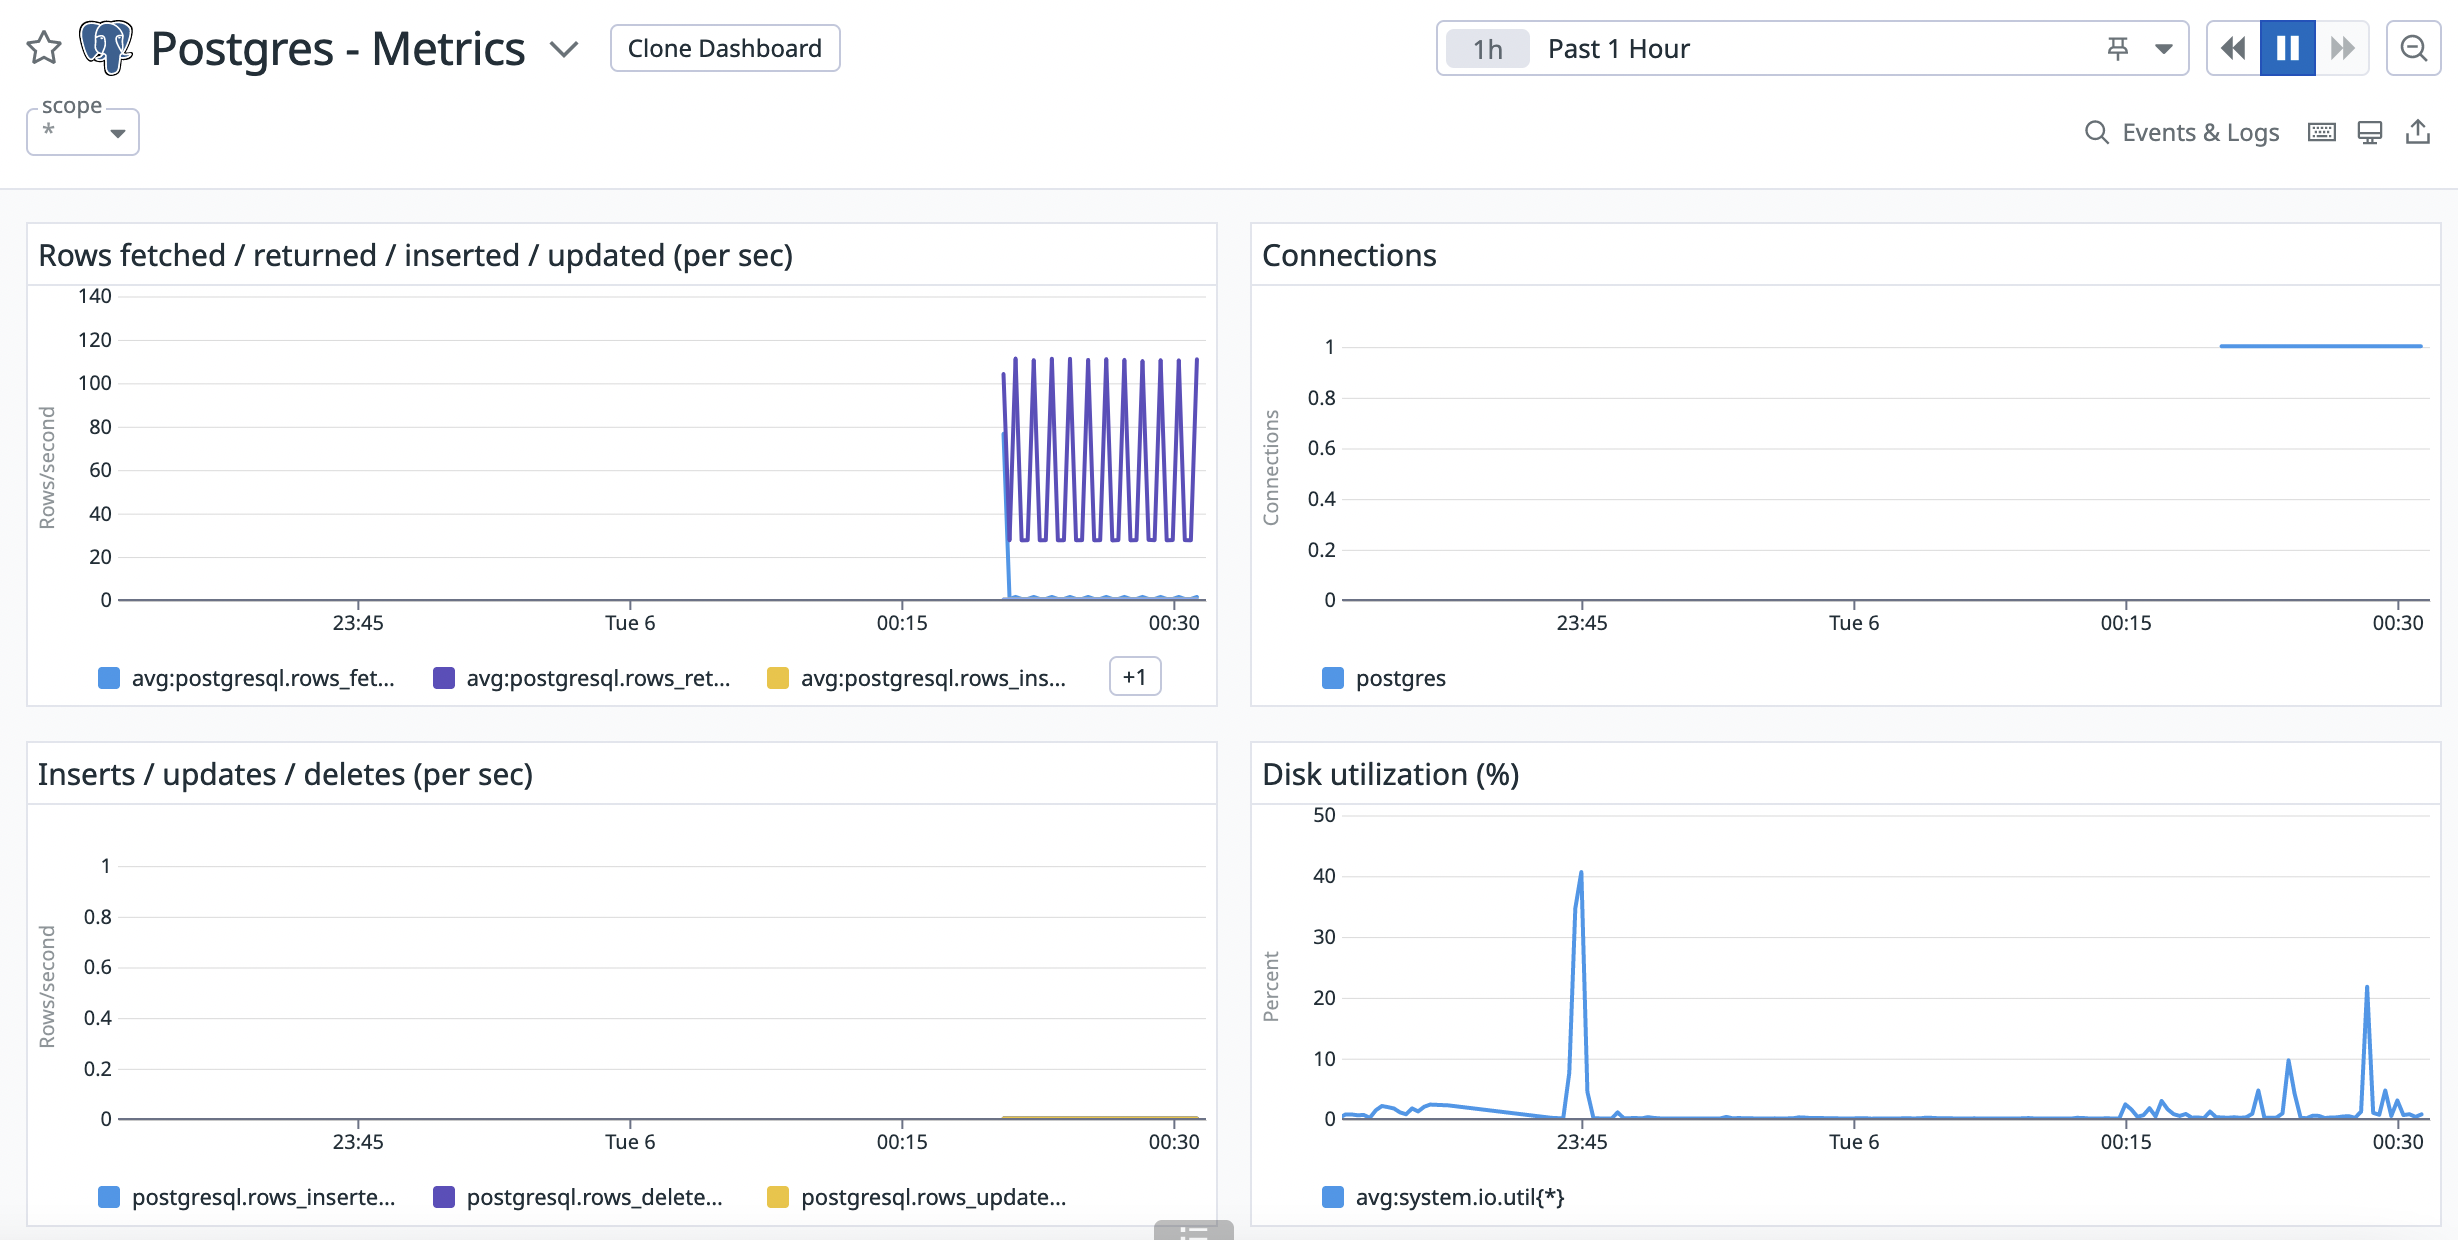
Postgres integration dashboard:
custom_my_metric.yaml:
init_config:

instances:
  - min_collection_interval: 45
custom_my_metric.py:
import random

# the following try/except block will make the custom check compatible with any Agent version
try:
    # first, try to import the base class from new versions of the Agent...
    from datadog_checks.base import AgentCheck
except ImportError:
    # ...if the above failed, the check is running in Agent version < 6.6.0
    from checks import AgentCheck

# content of the special variable __version__ will be shown in the Agent status page
__version__ = "1.0.0"

class CustomMyMetricCheck(AgentCheck):
    def check(self, instance):
        random_num = random.randint(0,1000)
        self.gauge('my_metric', random_num)
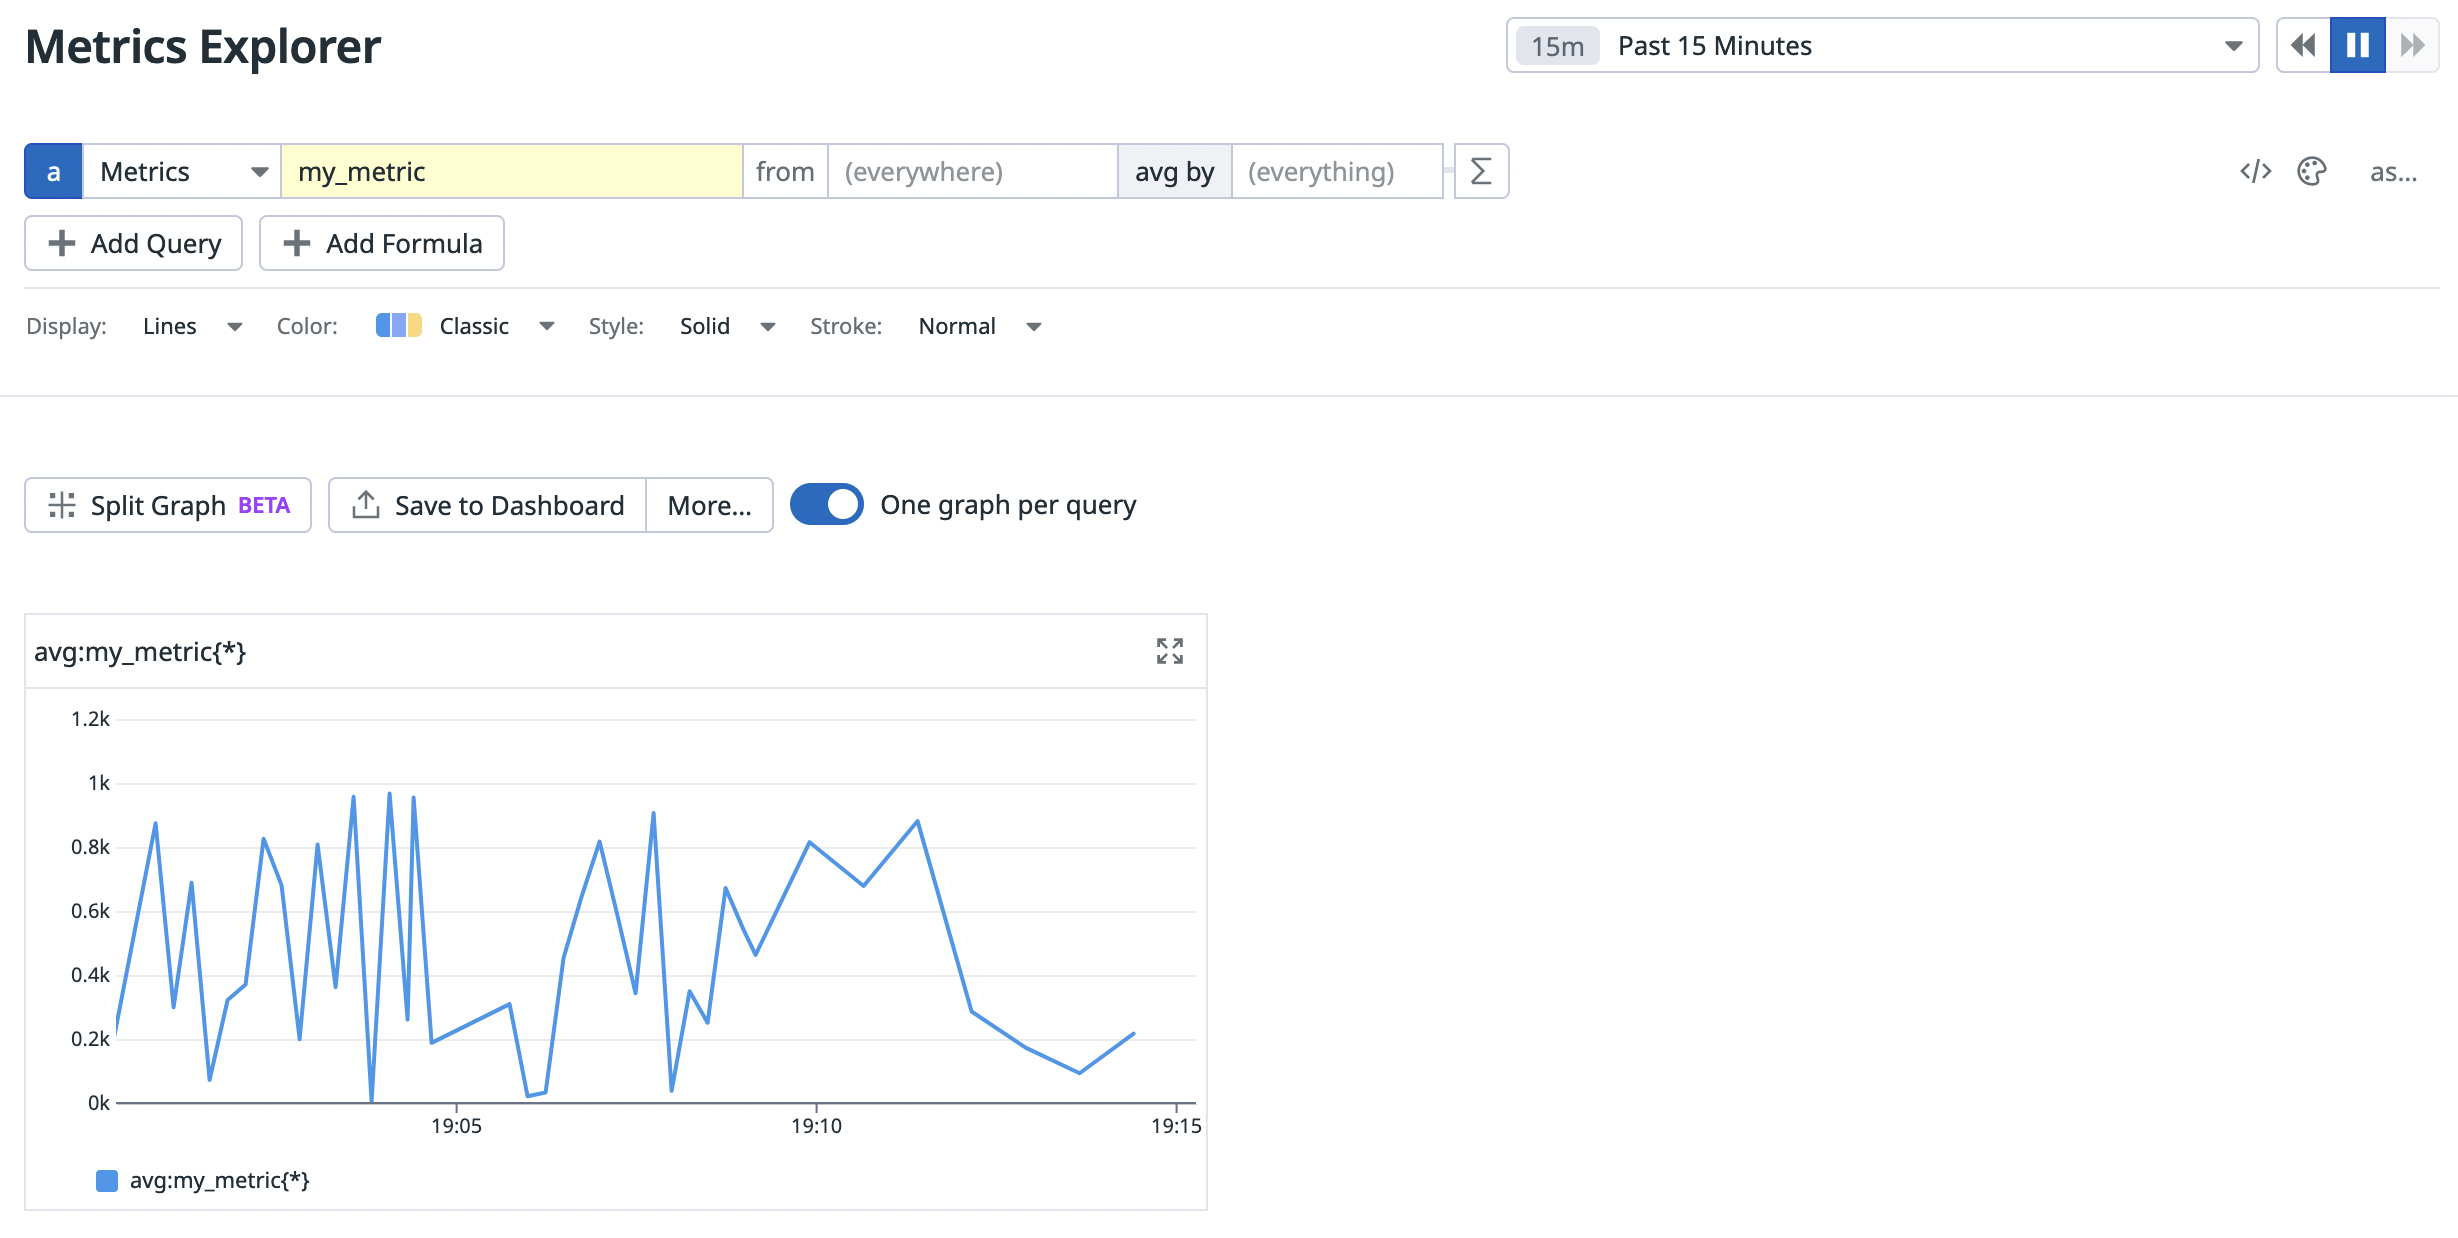
- You modify the
min_collection_intervalparameter in the Agent check YAML file.
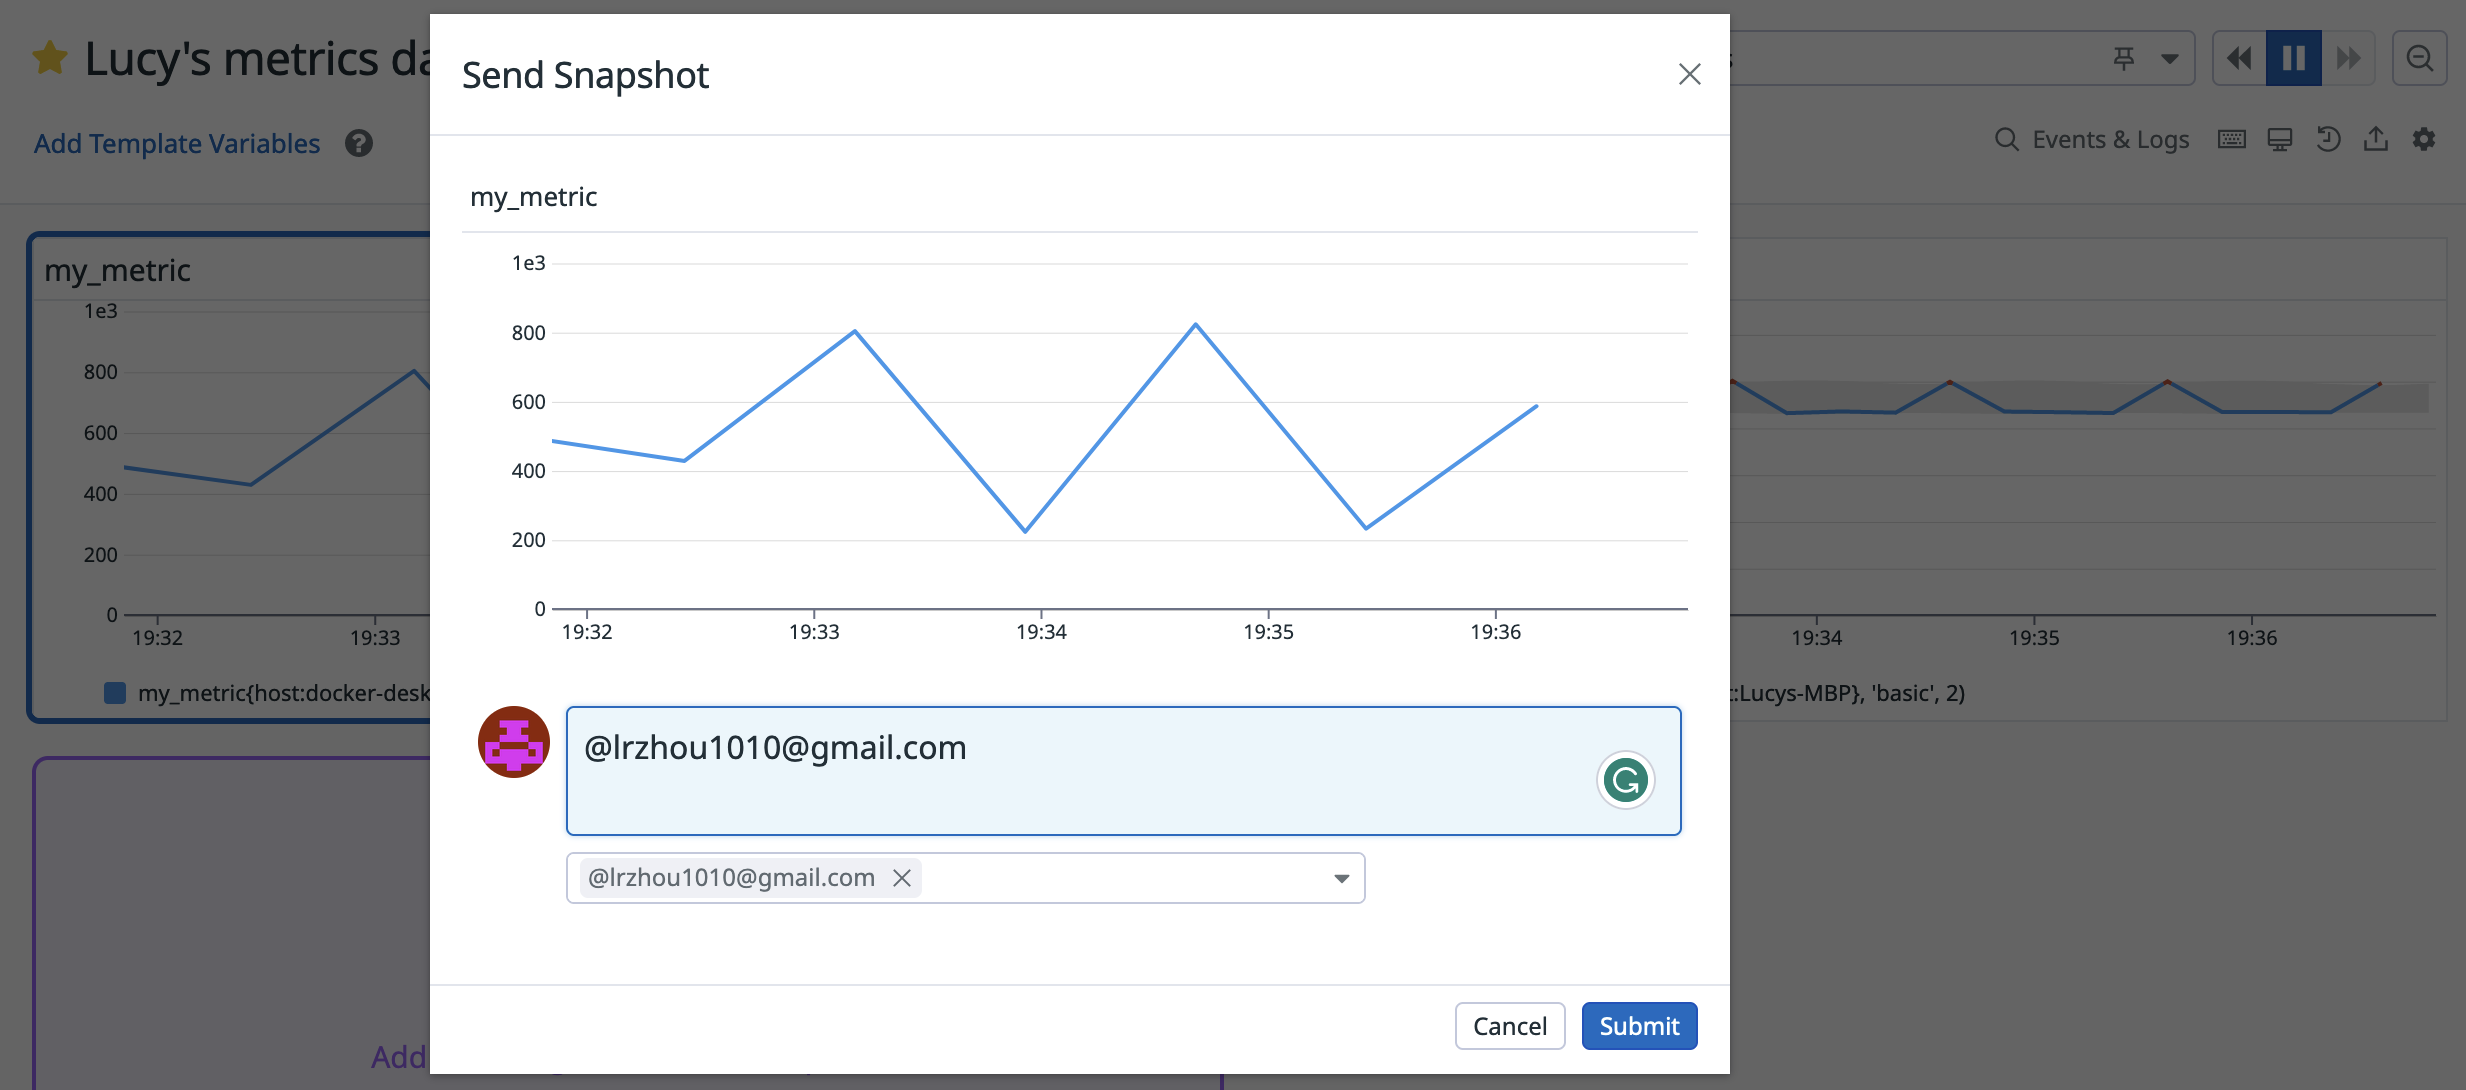
Exercise 2: Visualizing Data
- I used Postman to create a new dashboard using the following curl request:
curl --location 'https://us5.datadoghq.com/api/v1/dashboard' \
--header 'Content-Type: application/json' \
--header 'Accept: application/json' \
--header 'api_key: <DATADOG API KEY>' \
--header 'application_key: <DATADOG APPLICATION KEY>' \
--data '{
  "title": "Lucy'\''s metrics dashboard",
  "widgets": [
        {
          "definition": {
                "title": "my_metric",
                "title_size": "16",
                "title_align": "left",
                "type": "timeseries",
                "requests": [
                  {
                        "q": "my_metric{host:docker-desktop}"
                  }
                ]
            }
          },
          {
            "definition": {
            "title": "Anomalous Postgres commits",
            "title_size": "16",
            "title_align": "left",
            "type": "timeseries",
            "requests": [
                {
                    "q": "anomalies(postgresql.commits{host:Lucys-MBP}, '\''basic'\'', 2)"
                }
              ]
            }
         }
  ],
  "layout_type": "ordered"
}'
Shared dashboard URL: https://p.us5.datadoghq.com/sb/f4085cf8-fec9-11ed-967f-da7ad0900005-15f84545fbc0e1fd439335dc763d1b85
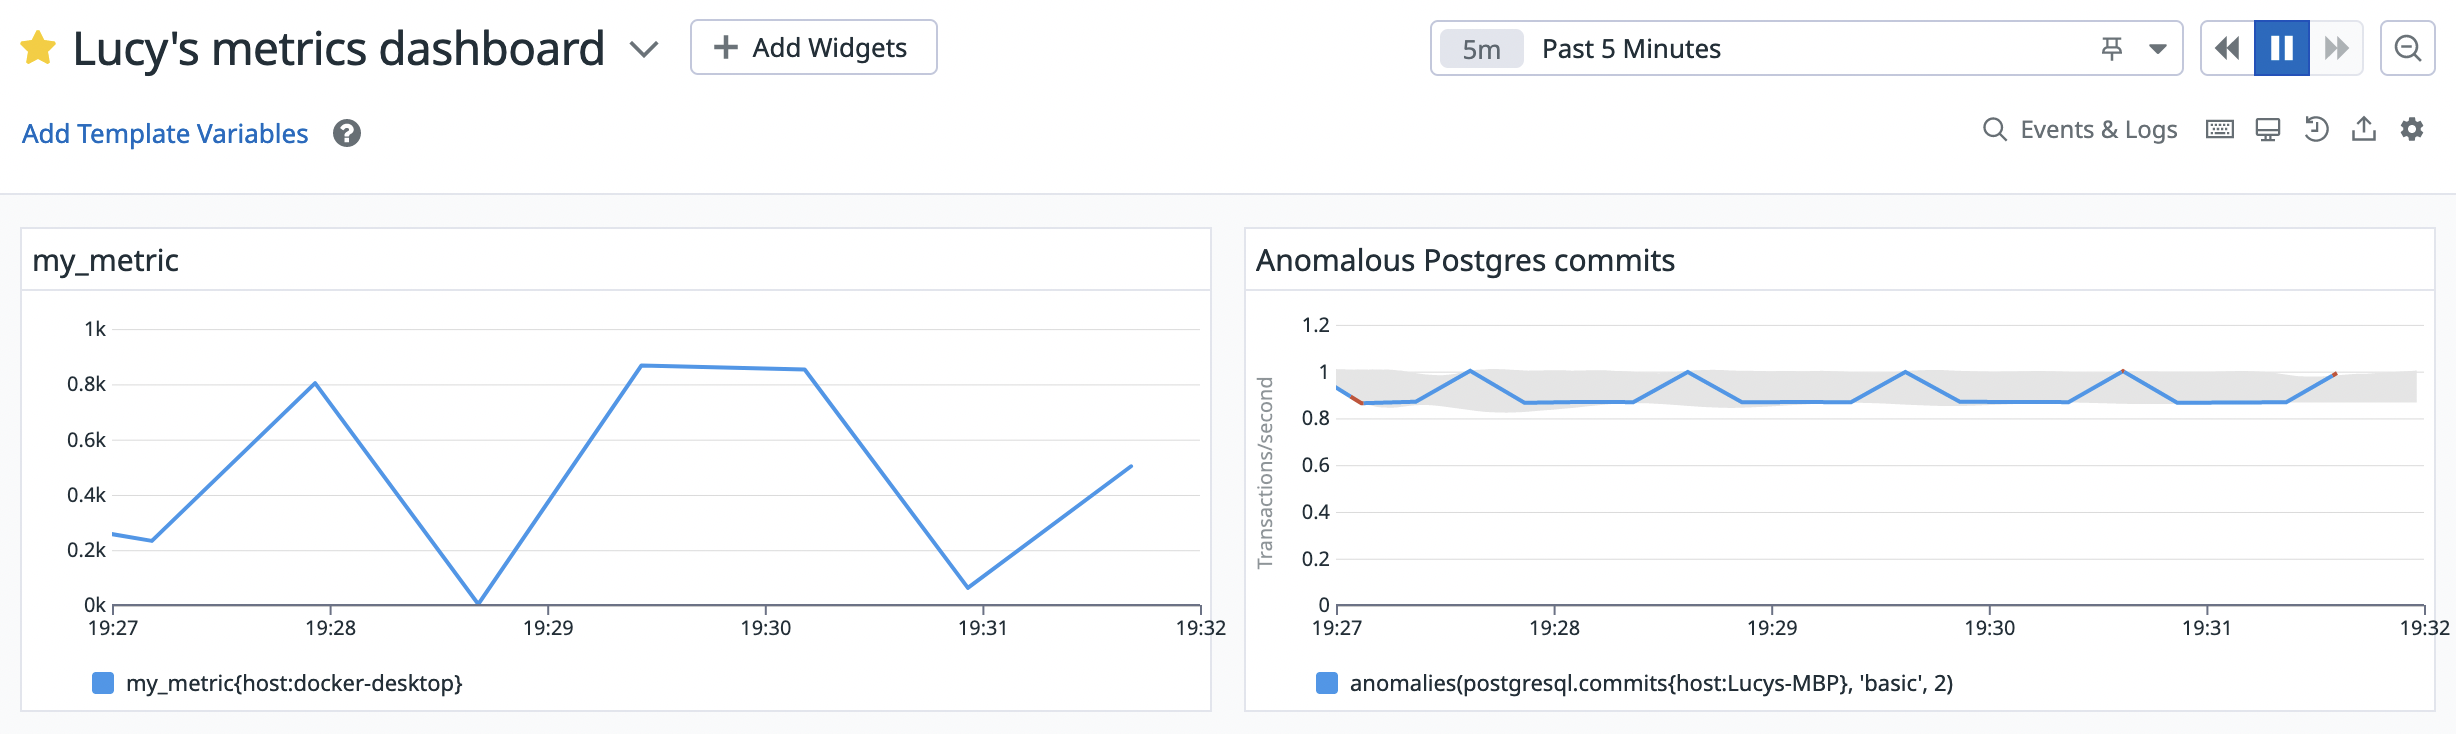
- The Anomaly graph displays a gray band that shows the expected behavior of the number of transactions that have been committed in the Postgres database, with anomalies, or points with a standard deviation of 2 or greater, highlighted in red.
Exercise 3: Getting Started with DogPush
DogPush is a Python library that enables you to manage Datadog monitors through YAML files. With DogPush, you can use source control to track and review changes to your monitors, notify your teams, and mute monitors within set time frames, such as outside of business hours.
Prerequisites
Before installing DogPush:
- Install the Datadog Agent.
- Install Python 3.7+.
- Generate valid Datadog API and Application keys. Find your keys under Datadog API Settings.
Install
Install DogPush using one of two methods:
pip
Before installing DogPush, install and run the latest version of pip:
pip install --upgrade pip
Then, install DogPush using pip:
pip install dogpush
Docker
To install DogPush using Docker, pull the DogPush Docker image:
docker pull trueaccord/dogpush
Note: The DogPush image is only compatible with AMD64 or Intel 64-bit architecture.
Skip ahead to the next section to create the config.yaml file. Then, run docker run and pass in the following arguments:
- The path of the
configdirectory that contains your configuration YAML files. - The path of
config.yaml.
This ensures that the Docker container can access the configuration YAML files.
docker run --rm -v /path/to/config:/config trueaccord/dogpush -c /config/config.yaml diff
Setup
DogPush manages your Datadog monitors through configuration YAML files:
config.yaml: defines your Datadog API and Application keys, teams, mute tags, and references yourrule_filesYAML files.rule_filesYAML files: configure your monitor alerts.
To set up DogPush:
- Create
config.yaml. - Add
rule_filesYAML file toconfig.yaml. - Define teams for notifications.
- Optional: Create mute tags.
1. Create config.yaml
a. Create a new directory config that stores your configuration YAML files:
mkdir config
b. In the new config directory, create the config.yaml file using your favorite text editor. Add your Datadog API and Application keys.
---
datadog:
  api_key: <YOUR_API_KEY>
  app_key: <YOUR_APP_KEY>
Note: If you don’t define your Datadog API and Application keys in config.yaml, DogPush also looks for the environmental variables DATADOG_API_KEY and DATADOG_APP_KEY.
c. Run dogpush diff and pass in your new config.yaml as an argument:
dogpush -c ./config.yaml diff
dogpush diff prints untracked changes across your local config.yaml file and remote Datadog monitors. Because config.yaml currently only contains information about your Datadog API and Application keys, all your monitor alerts should appear as untracked in your terminal.
Now that you have printed your monitor alerts in your local environment, let’s store them in a new rule_files YAML file, my_monitors.yaml.
2. Add rule_files YAML file to config.yaml
a. In the config directory, run dogpush init to create a new YAML file, my_monitors.yaml, that stores the untracked monitor alerts you printed in the last step.
dogpush -c ./config.yaml init > ./my_monitors.yaml
b. In config.yaml, add my_monitors.yaml as a new rule_files entry. rule_files lists the configuration YAML files that locally store and configure your monitor alerts.
---
datadog:
  api_key: <YOUR_API_KEY>
  app_key: <YOUR_APP_KEY>

rule_files:
- my_monitors.yaml
c. Run dogpush diff again. It should not print any untracked changes. Your monitor alerts are now in sync across your local config.yaml and remote Datadog monitors.
You can create separate configuration YAML files grouping together monitor alerts by team, monitor type, or another organizing principle. Just add the YAML files to the rule_files entry in config.yaml.
Note: rule_files YAML paths can be relative, absolute, and contain wildcards.
rule_files:
- rds.yaml
- ec2.yaml
- dir1/rules.yaml
- /absolute/path/to/rules.yaml
- path/with/wildcard/*.yaml
3. Define teams for notifications
Define teams to notify the right people about monitor issues.
To define teams:
a. In your config.yaml file, create a new teams entry for eng. For each monitor severity level, use the @ notation to specify the team(s) that should be notified in the message body of the monitor. Below is an example teams entry:
teams:
  eng:
	notifications:
  	  CRITICAL: '@hipchat-Engineering @victorops-eng'
  	  WARNING: '@eng-alerts@example.com'
b. Add team: eng to the top of the desired rule_files YAML file(s). This sets eng as the default team for the monitor alerts defined in the YAML file(s).
- For
CRITICALalerts,@hipchat-Engineering @victorops-engare added to the monitor message. - For
WARNINGalerts,@eng-alerts@example.comis added to the monitor message.
c. Add another teams entry for ops:
ops:
  notifications:
    CRITICAL: '@hipchat-Ops'
d. To define both eng and ops as the default teams for a set of monitor alerts, add the following to the desired rule_files YAML file(s):
team: [eng, ops]
e. If you want don’t want a monitor to be associated with a team, set team to an empty array:
team: []
For more information about notifying your teams, see Notifications.
Optional: Create mute tags
Create mute tags to mute monitors within set time frames. Each mute tag is defined by the following:
timezone: localizes the time frame to a specific timezone.expr: sets the time frame as a Python expression.
In this section, we will walk you through how to set up a mute tag that mutes your monitors outside of business hours in US Pacific Time (PST), which we define as before 9 am and after 5 pm on the weekends.
To create a mute tag:
- In
config.yaml, addnot_business_hoursas a newmute_tagsentry:
- Set the
timezonetoUS/Pacific. - Set the
exprtonow.hour < 9 or now.hour >= 17 or (now.weekday() in (5, 6)), where now represents the local date and time in the timezone you set.
mute_tags:
  not_business_hours:
	timezone: US/Pacific
	expr: now.hour < 9 or now.hour >= 17 or (now.weekday() in (5, 6))
Note: Regardless of your system’s default timezone, DogPush performs its internal time calculations in UTC.
- After saving
config.yaml, addmute_when: not_business_hoursto the desiredrule_filesYAML file(s). As a result, DogPush only mutes monitors with the mute tagnot_business_hoursapplied. - Run
dogpush muteto mute monitors. After the mute tag’s time frame expires, monitors are automatically unmuted. To repeatedly mute monitors at a specific time, rundogpush mutefrom a cron job.
Further reading
For further reading, see the following resources: